Dr Shane Oliver – Head of Investment Strategy and Chief Economist, AMP Capital
Key points
-
Compound interest is an investor’s best friend.
-
The higher the return, the greater the investment contribution and the longer the period the more it works.
-
To make the most of it, ensure an adequate exposure to growth assets, contribute early and often to your investment portfolio and find a way to avoid being thrown off by the investment cycle.

Introduction
If there is one “technical thing” investors should know about investing, it’s the power of compound interest. In the rush to understand short-term developments impacting investment markets regarding the economy, interest rates, profits, politics, etc, and in recent times coronavirus its often forgotten about. It can be the worst nightmare of borrowers as interest gets charged on interest if it’s not regularly serviced. But it’s the best friend of investors. The well-known Australian economist Dr Don Stammer refers to it as the “magic” of compound interest. I often refer to it, but given its importance, this note updates one I wrote a few years ago looking at what it is, how it works, various issues around it and why investors often miss out.
What is compound interest?
Compound interest is simply the concept of earning interest on interest or getting a return on past returns. In other words, any interest or return earned in one period is added to the original investment so that it all earns interest or a return in the next period. And so on. Its best demonstrated by some examples.
-
Suppose an investor invests $500 at the start of each year and receives a 3% annual return (see Case A in the next table). After 20 years the investment will have increased to $13,838, for a total outlay (or $ Flow) of $10,000.
-
But if the investor put the same flow of money in say a higher risk asset returning an average 7% a year, after 20 years it will have grown to $21,933 (Case B). And in year 20, annual earnings are now $1,435, far above the investment earnings in the same year in Case A of $403.
-
Finally, if the process was kicked off by a $2000 investment at the start of the first year, with $500 each year thereafter and still earning 7% per annum then after 20 years it will have grown to $27,737 (Case C). By year 20 in this case the annual investment earnings will have increased to $1,815.
These examples are relatively simple, in order to show how compounding works. All sorts of complications can affect the final outcome including inflation (which would boost the nominal results as the table uses relatively low nominal returns), more frequent compounding which occurs in investment markets (which would also boost the final outcome) and the timing of the average return from the high growth/more risky asset through time in that it won’t be a steady 7% year after year.
Compound interest
|
Year |
Case A |
Case B |
Case C then $500 pa, 7% |
|||
|
|
$ Inv |
$ Flow |
$ Inv |
$ Flow |
$ Inv |
$ Flow |
|
1 |
515 |
500 |
535 |
500 |
2140 |
2000 |
|
2 |
1046 |
500 |
1108 |
500 |
2825 |
500 |
|
3 |
1592 |
500 |
1720 |
500 |
3558 |
500 |
|
4 |
2155 |
500 |
2375 |
500 |
4342 |
500 |
|
5 |
2734 |
500 |
3077 |
500 |
5181 |
500 |
|
6 |
3331 |
500 |
3827 |
500 |
6078 |
500 |
|
7 |
3946 |
500 |
4630 |
500 |
7039 |
500 |
|
8 |
4580 |
500 |
5489 |
500 |
8066 |
500 |
|
9 |
5232 |
500 |
6408 |
500 |
9166 |
500 |
|
10 |
5904 |
500 |
7392 |
500 |
10343 |
500 |
|
11 |
6596 |
500 |
8444 |
500 |
11602 |
500 |
|
12 |
7309 |
500 |
9570 |
500 |
12949 |
500 |
|
13 |
8043 |
500 |
10775 |
500 |
14390 |
500 |
|
14 |
8800 |
500 |
12065 |
500 |
15932 |
500 |
|
15 |
9578 |
500 |
13444 |
500 |
17583 |
500 |
|
16 |
10381 |
500 |
14920 |
500 |
19348 |
500 |
|
17 |
11207 |
500 |
16500 |
500 |
21238 |
500 |
|
18 |
12058 |
500 |
18190 |
500 |
23259 |
500 |
|
19 |
12935 |
500 |
19998 |
500 |
25423 |
500 |
|
20 |
13838 |
500 |
21933 |
500 |
27737 |
500 |
|
Total |
10,000 |
10,000 |
11,500 |
|||
Source: AMP Capital
However, the power of compound interest is clear. From these examples, it is evident that it has three key drivers:
-
The rate of return – the higher the better.
-
The contribution – the bigger the better as it means there is more to compound on. The $2,000 upfront contribution in Case C boosted the outcome after 20 years by $5804 versus Case B. Not bad for just an extra $1,500 investment.
-
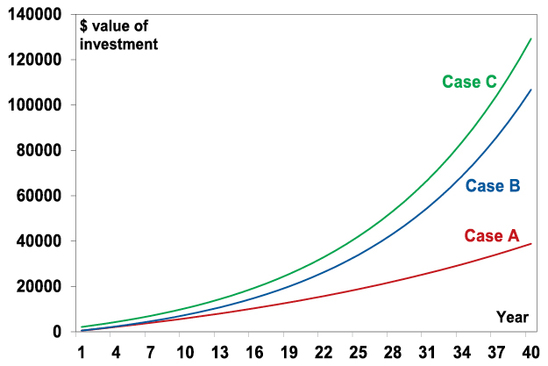
Time – the longer the better as it means the longer the compounding process of earning returns on returns has to run. Time also helps smooth out any year-to-year volatility in returns. After 40 years the investment strategy in Case A will have grown to $38,832 but Case B will have grown to $106,805 and Case C will have grown to $129,267.
The next chart illustrates how after about 15 to 20 years the value of the investment in the higher returning cases starts to rise exponentially as returns build on top of returns. This is why compound interest is often described as “magical”.
Compound interest

Source: AMP Capital
Compound interest in practice
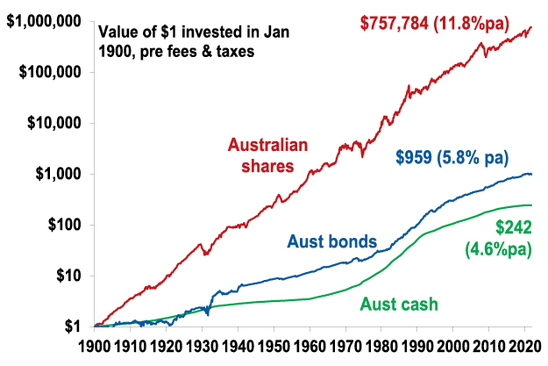
Growth assets like shares and property provide higher returns than defensive assets like cash and bonds over long periods. This is because their growth potential drives higher returns over long periods of time compensating for their higher volatility. The next chart is my favourite demonstration of the power of compound interest in action. It shows the value of $1 invested in 1900 in Australian cash, bonds and shares with earnings on each asset reinvested along the way. Since 1900 cash has returned 4.8% pa, bonds returned 5.8% pa & shares 11.8% pa.
Shares versus bonds & cash over very long term – Australia
Source: Global Financial Data, AMP Capital
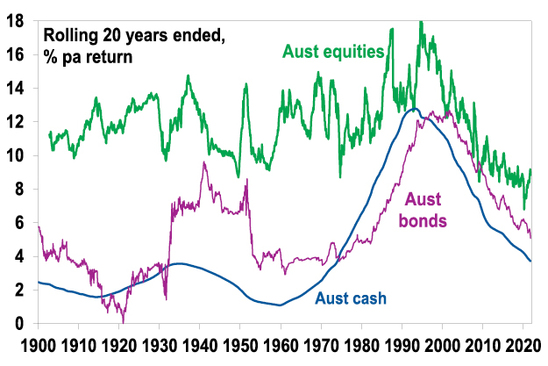
Shares are more volatile than cash and bonds. However, the compounding effect of their higher returns over time results in much higher wealth accumulation from them. Although the return from shares is only double that of bonds, over 121 years the $1 invested in 1900 will have grown to $757,784 today, whereas the $1 investment in bonds will only be worth $959 and that in cash just $242. Of course, investors don’t have 121 years. But the next chart shows rolling 20 year returns from Australian shares, bonds and cash and its evident shares have invariably outperformed cash and bonds over such a period.
Investment returns over rolling 20 yr periods – Australia
Source: Bloomberg, AMP Capital
While the return gap between shares on the one hand and bonds and cash on the other narrowed over the last 30 years this reflects the high interest rates and bond yields of 20-30 years ago, which drove relatively high returns from these assets. With bond yields and interest rates now very low such returns are very unlikely to be repeated from these assets.
Some issues
What about property? Over long periods of time Australian residential property has generated similar total returns (ie capital growth plus income) as Australian equities. For example, since 1926 Australian residential property has returned 10.7% pa, which is similar to the 11.3% pa return from shares.
What about fees? Fees on managed investment products will reduce returns over time, but less so for cash and fixed income products and for equities the impact will be offset by franking credits in the case of Australian shares (which are around 1.2% pa) and which have not been allowed for in the last two charts.
Are these returns sustainable? This is a separate issue, but the historical returns from the four assets likely all exaggerate their future medium term (say 10 year) return potential. Cash rates and bank term deposit rates are currently below 1% and may only average 1 to 3% over the medium term, current 10-year bond yields around 1.7% suggest pretty low bond returns for the decade ahead (in fact just 1.7% for an investor who buys and holds a 10-year bond). And the Australian equity return may be closer to 8% pa, reflecting a grossed up for franking credits dividend yield around 5% and capital growth around 3%. But for shares this sort of return is not bad and still leaves in place significant potential for investors to reap rewards from the power of compounding over the long term.
But why do investors often miss out?
But what can cause investors to miss out on the power of compound interest if its so obvious? There are several reasons:
-
First investors may be too conservative in their investment strategy, opting for lower returning defensive assets like cash or bank deposits. This may avoid short term volatility but won’t build wealth over the long term.
-
Second, they leave it too late to start investing or don’t contribute much initially. This makes it difficult to catch up in later life & leaves them more at the whim of financial market swings. Fortunately, the superannuation system forces Australian’s to start early in life, albeit last year’s pandemic related early withdrawals may have thrown this off for some.
-
Third, they attempt to “beat” the market by either trying to time market moves up or down or buying and selling particular stocks. Getting this right is easier said that done and investors often end up getting it wrong – buying at the top and selling at the bottom which destroys wealth.
-
Fourth, they are not diversified enough.
-
Finally, some are sucked in over the years into investment opportunities seeming to promise a free lunch, which then fail. The key is to check the asset is producing fundamental value and not just dependent on the crowd pushing it higher.
Implications for investors
There are several implications for investors looking to take advantage of the power of compound interest.
First, if you can take a long-term approach, focus on growth assets like shares and property with a long-term track record. Second, start contributing to your investment portfolio as much as you can as early as possible.
Third, find a way to manage cyclical swings. For example, invest a bit of time in understanding that the investment cycle is a normal part of investment markets and partly explains why growth assets have a higher return in the first place.
Finally, if an investment sounds too good to be true – implying a free lunch – or you can’t understand it, then stay away.
Source: AMP Capital November 2021
Important note: While every care has been taken in the preparation of this document, AMP Capital Investors Limited (ABN 59 001 777 591, AFSL 232497) and AMP Capital Funds Management Limited (ABN 15 159 557 721, AFSL 426455) make no representations or warranties as to the accuracy or completeness of any statement in it including, without limitation, any forecasts. Past performance is not a reliable indicator of future performance. This document has been prepared for the purpose of providing general information, without taking account of any particular investor’s objectives, financial situation or needs. An investor should, before making any investment decisions, consider the appropriateness of the information in this document, and seek professional advice, having regard to the investor’s objectives, financial situation and needs. This document is solely for the use of the party to whom it is provided.


